Episode 3: Generating Signals
In this episode, you learn how to generate test signals with g.Pype.
We start with the same code from the previous episode. Note that the Generator constructor
parameters channel_count, signal_frequency, signal_shape, signal_amplitude,
and noise_amplitude are now explicitly set. We will explore their meaning in the following.
 1import gpype as gp
 2
 3if __name__ == "__main__":
 4
 5    app = gp.MainApp()
 6    p = gp.Pipeline()
 7
 8    source = gp.Generator(channel_count=8,
 9                          signal_frequency=10,
10                          signal_shape=gp.Generator.SHAPE_SINUSOID,
11                          signal_amplitude=25,
12                          noise_amplitude=0)
13
14    scope = gp.TimeSeriesScope()
15
16    p.connect(source, scope)
17
18    app.add_widget(scope)
19
20    p.start()
21    app.run()  # blocking until window is closed
22    p.stop()
But first, run the script and make sure it produces the same output as before.
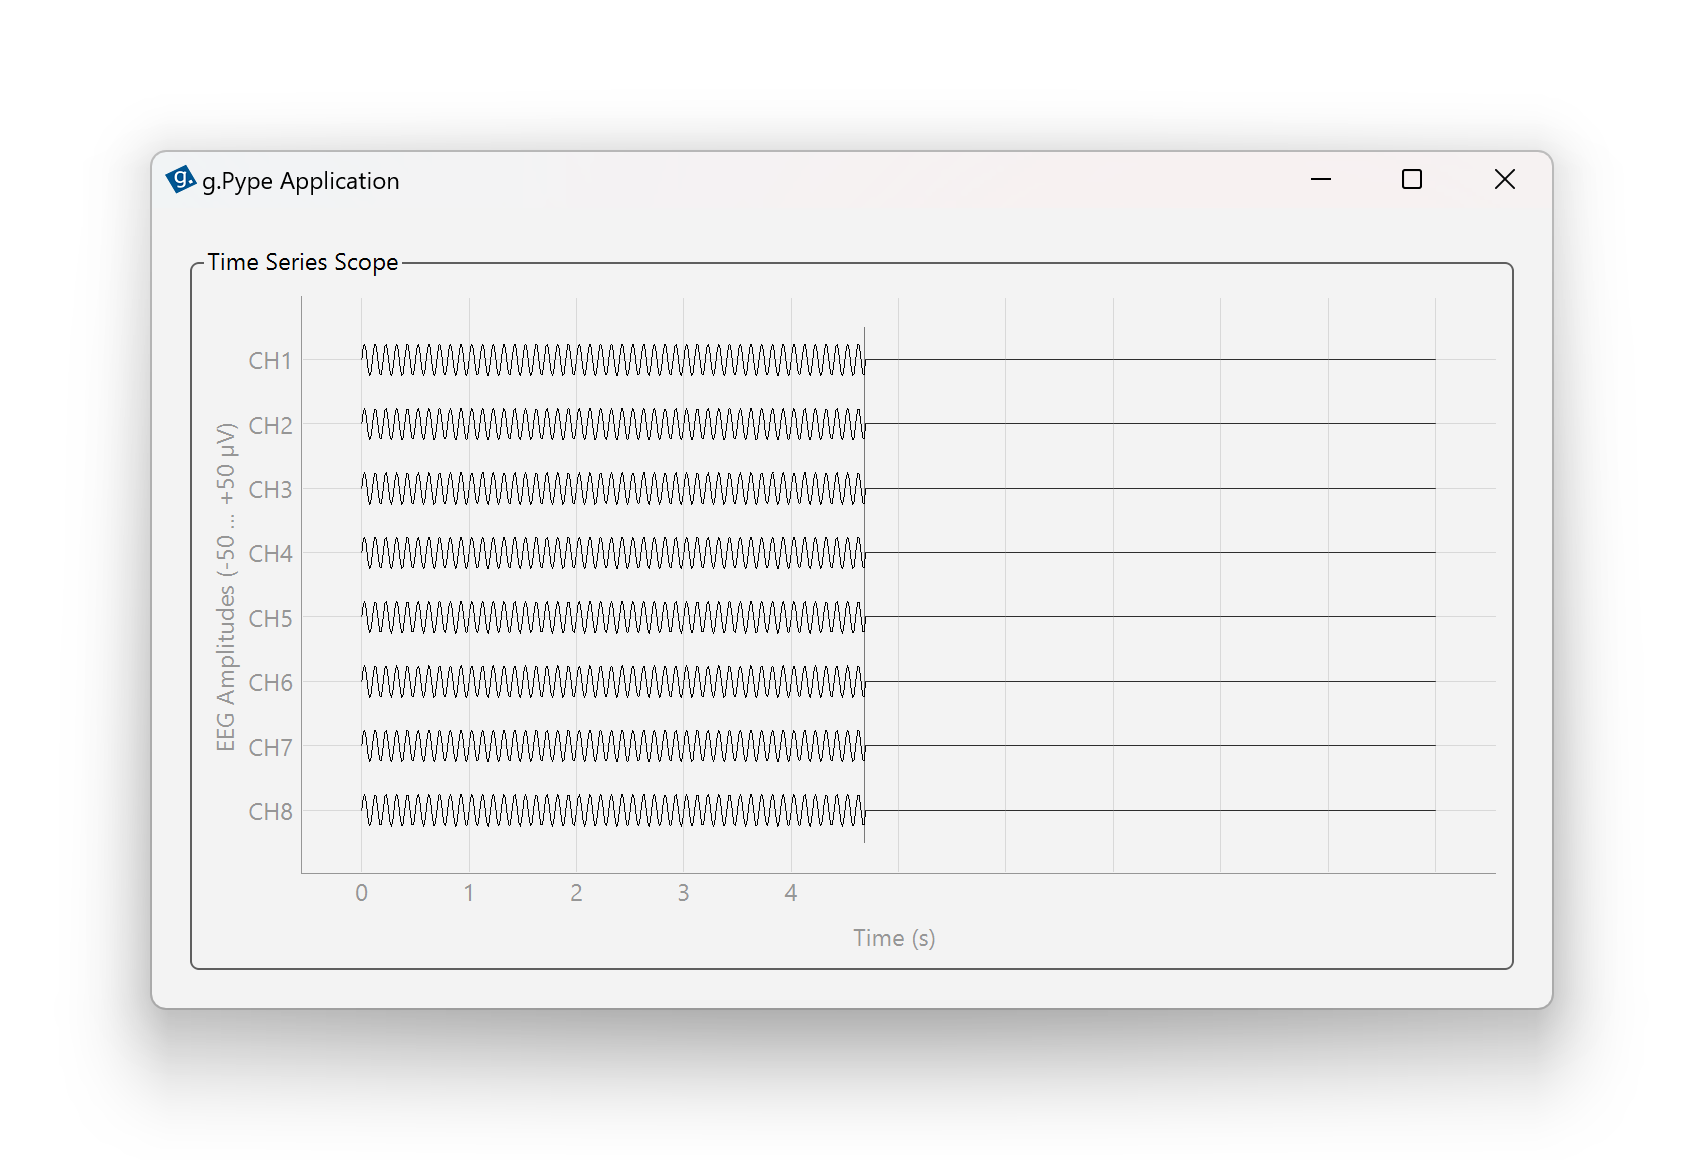
Figure 2: A minimal g.Pype application running with a signal generator and time series scope.
Now, let’s learn how to customize the signal generated by the Generator node.
The Generator can produce multiple channels in parallel. The default is eight channels.
Change the channel count to 4 via channel_count=4 in the parameter list. Run the script
again and observe that only four channels are shown.

Figure 3: Reducing the channel count to 4.
You can set the frequency of the generated signal in Hertz (Hz). The default is 10 Hz.
Change the signal frequency to 1 Hz via signal_frequency=1 in the parameter list.
Run the script again and observe how slow the waves are now.
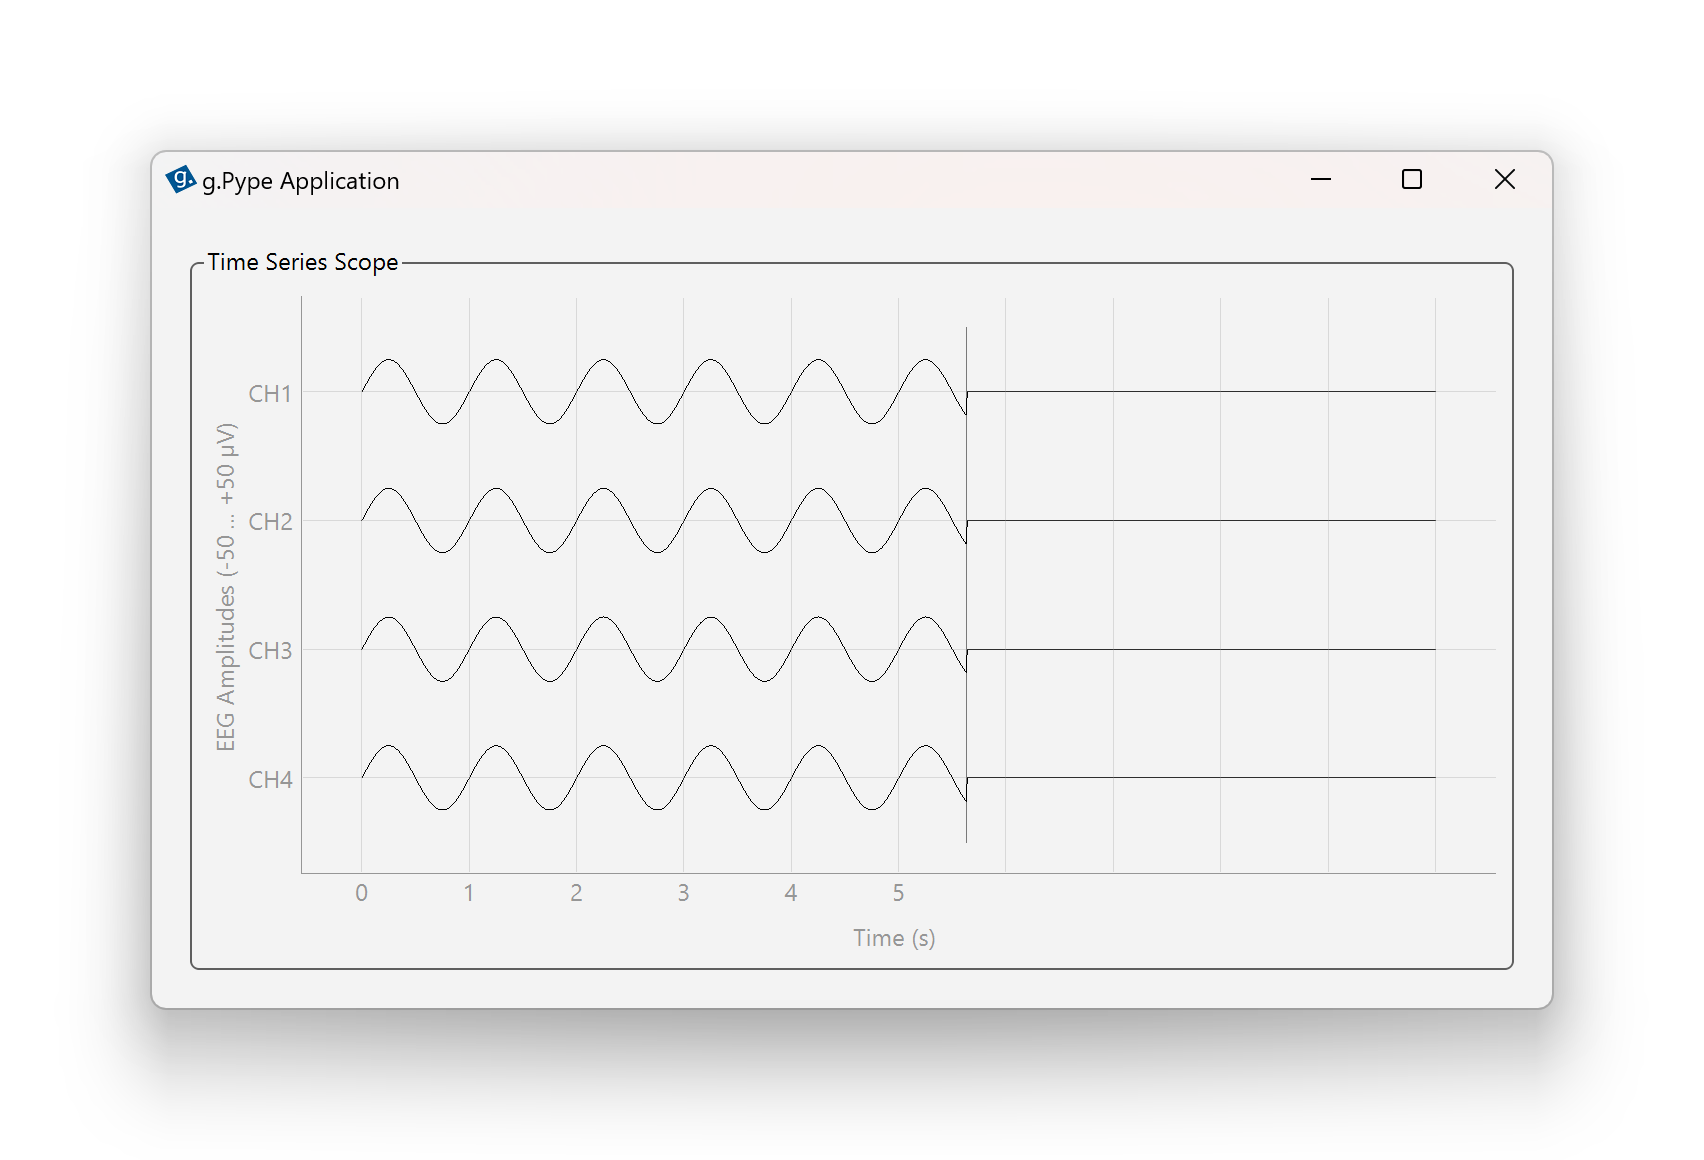
Figure 4: Slowing down the sine waves to 1 Hz.
The Generator provides three predefined signal shapes you can choose from:
Generator.SHAPE_SINUSOID– Sinusoidal waveform (default)Generator.SHAPE_RECTANGULAR– Square waveGenerator.SHAPE_PULSE– Brief pulses at specified frequency
Set signal_shape=gp.Generator.SHAPE_RECTANGULAR in the parameter list and run the
script again. Observe how the sine waves have turned into rectangular ones.
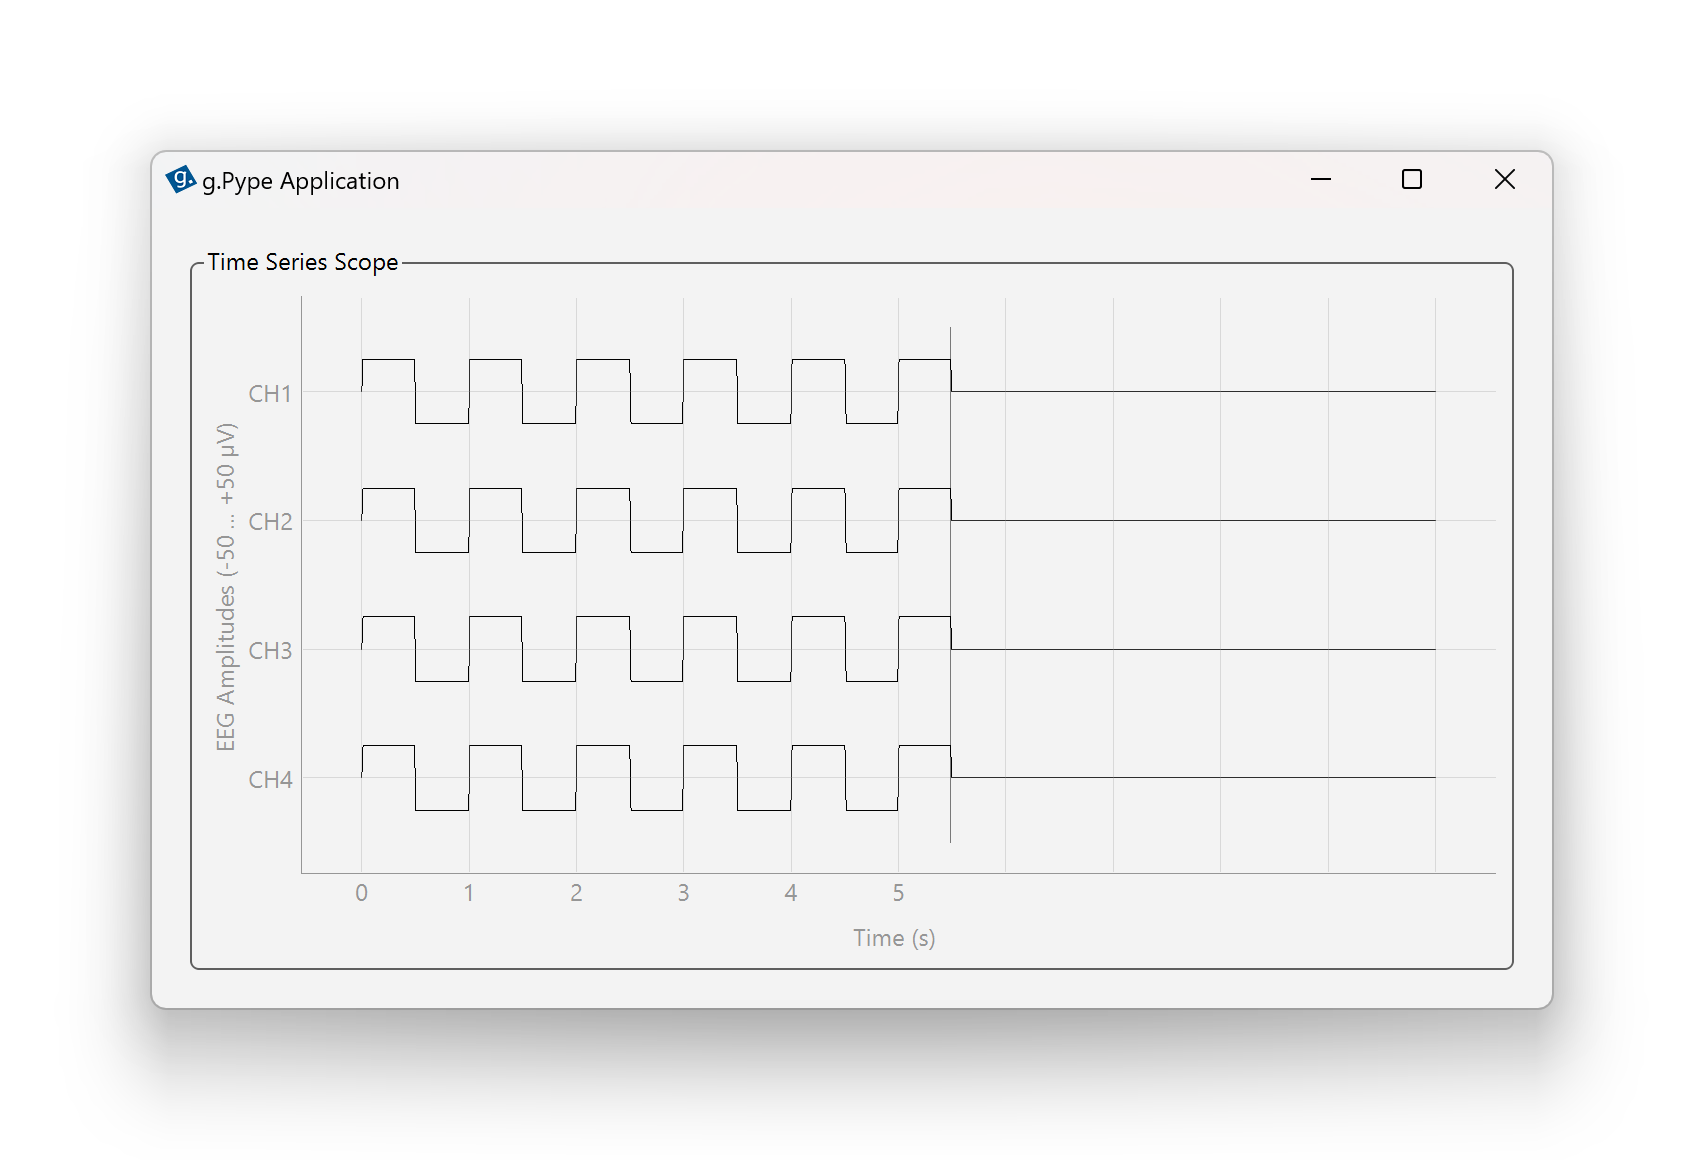
Figure 5: Changing signal shape to rectangular waveforms.
You can set the amplitude of the generated signal in µV. Change the amplitude via
signal_amplitude=10 in the parameter list. Run the script again and
observe how small the signals have become.
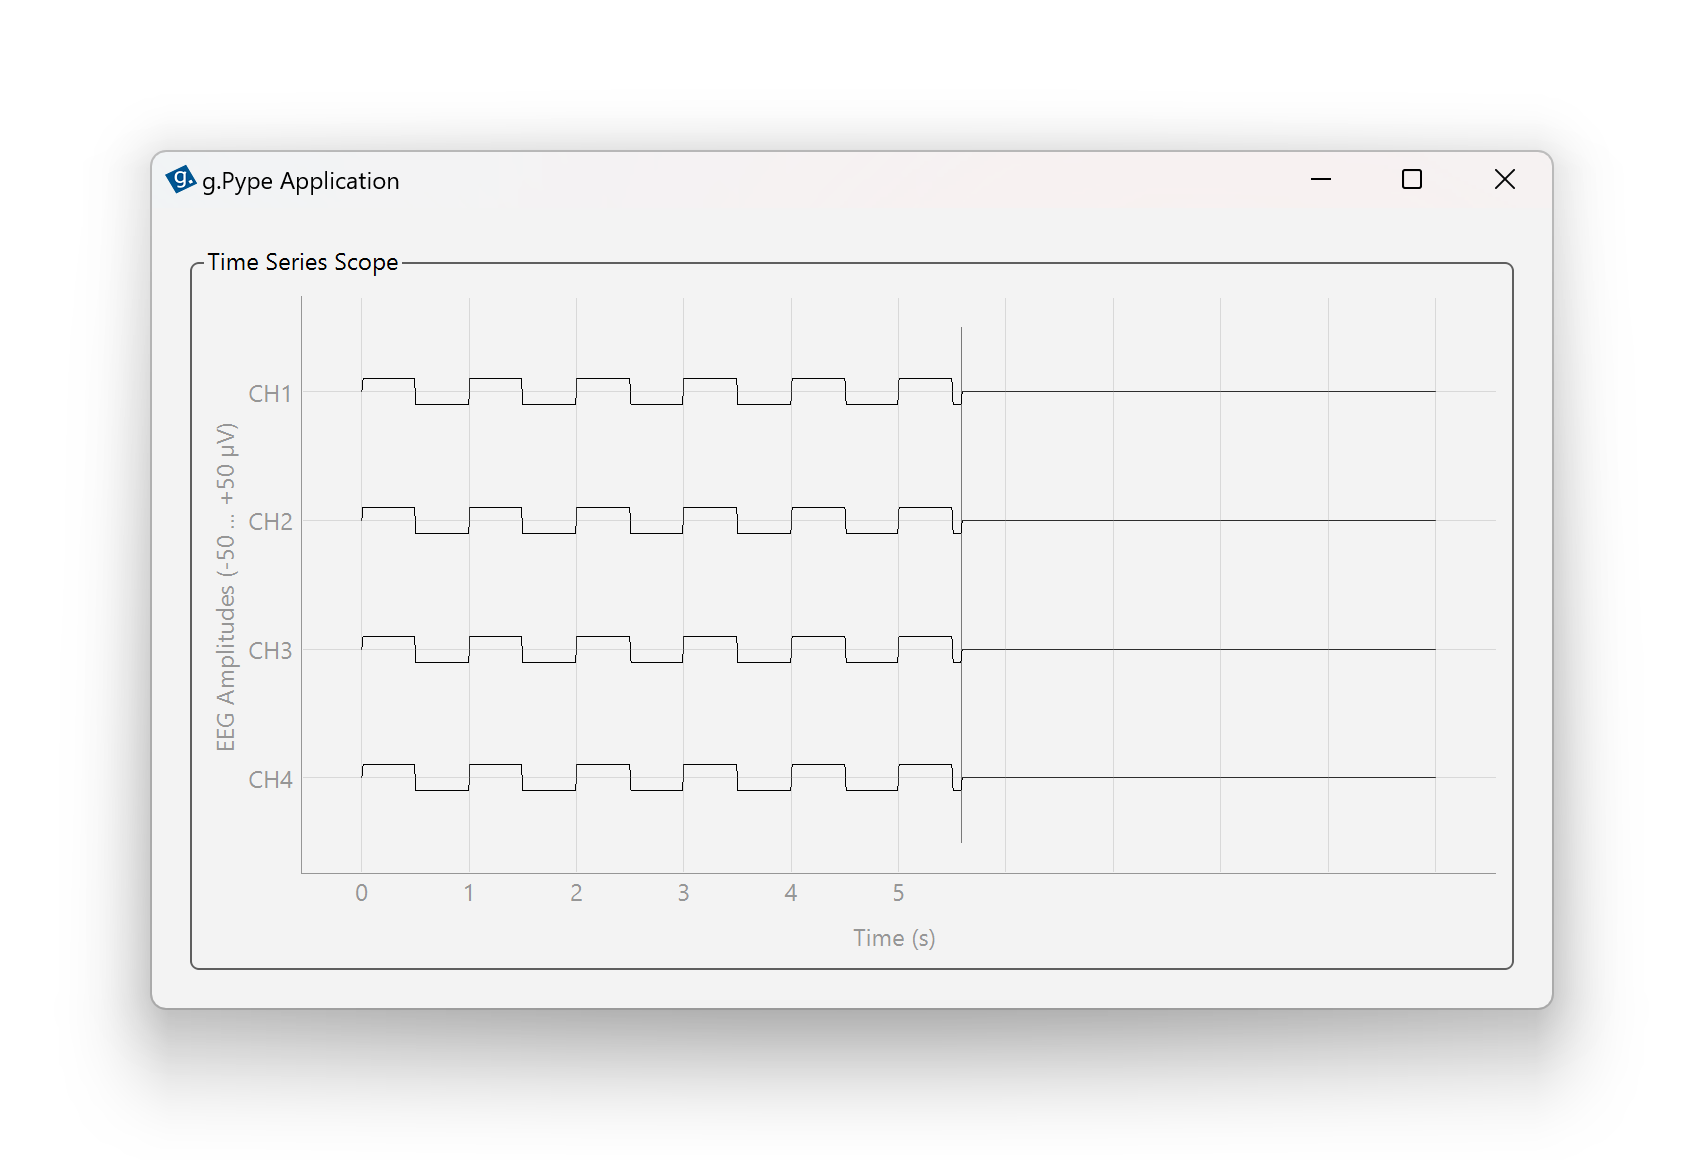
Figure 6: Reducing signal amplitude to 10 µV.
It is also possible to add noise to the signal. By default, no noise is added.
Set noise_amplitude=10 to add white Gaussian random noise with standard
deviation of 10 µV to the signal. Run the script again and observe how
much noise is there.
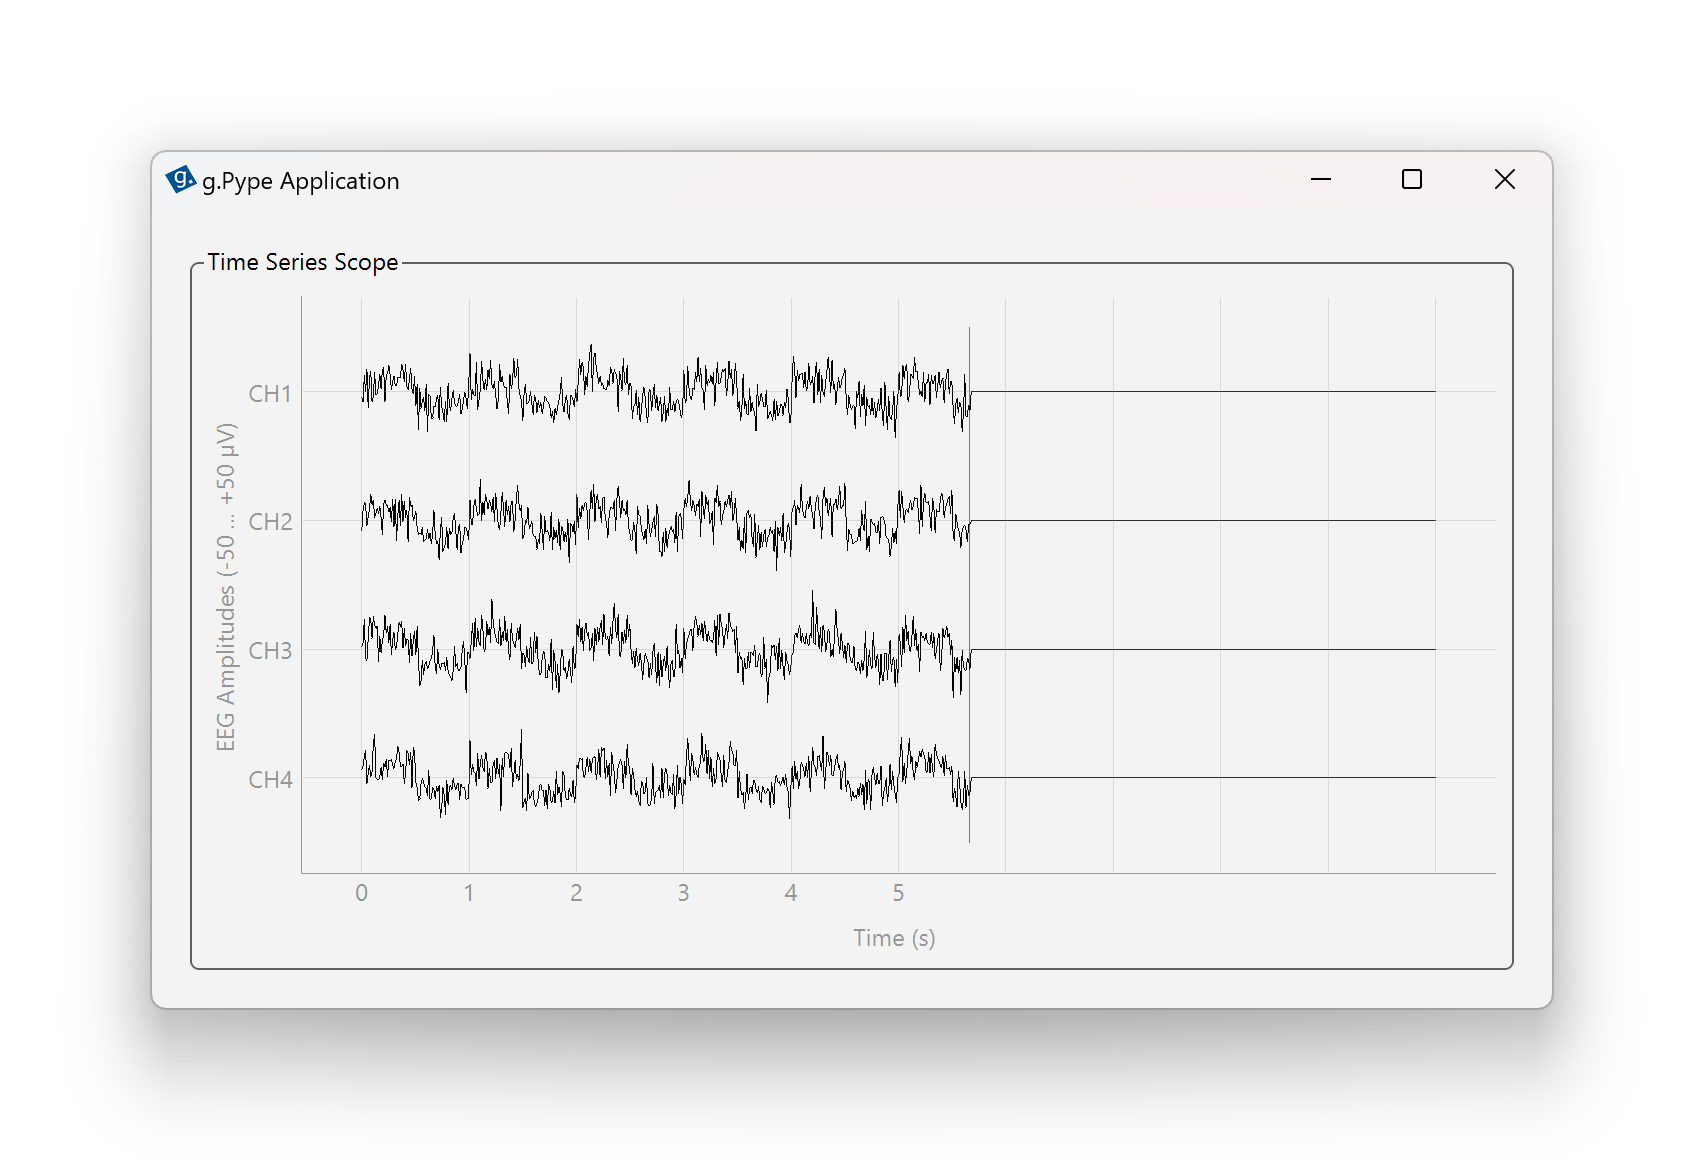
Figure 7: Adding noise with 10 µV standard deviation to the signal.
You can also set signal_amplitude=0 while keeping the noise amplitude
to generate pure noise. This can be useful for generating more complex
signals, as we will see later in this training. Run the script again
and observe that only noise remains.
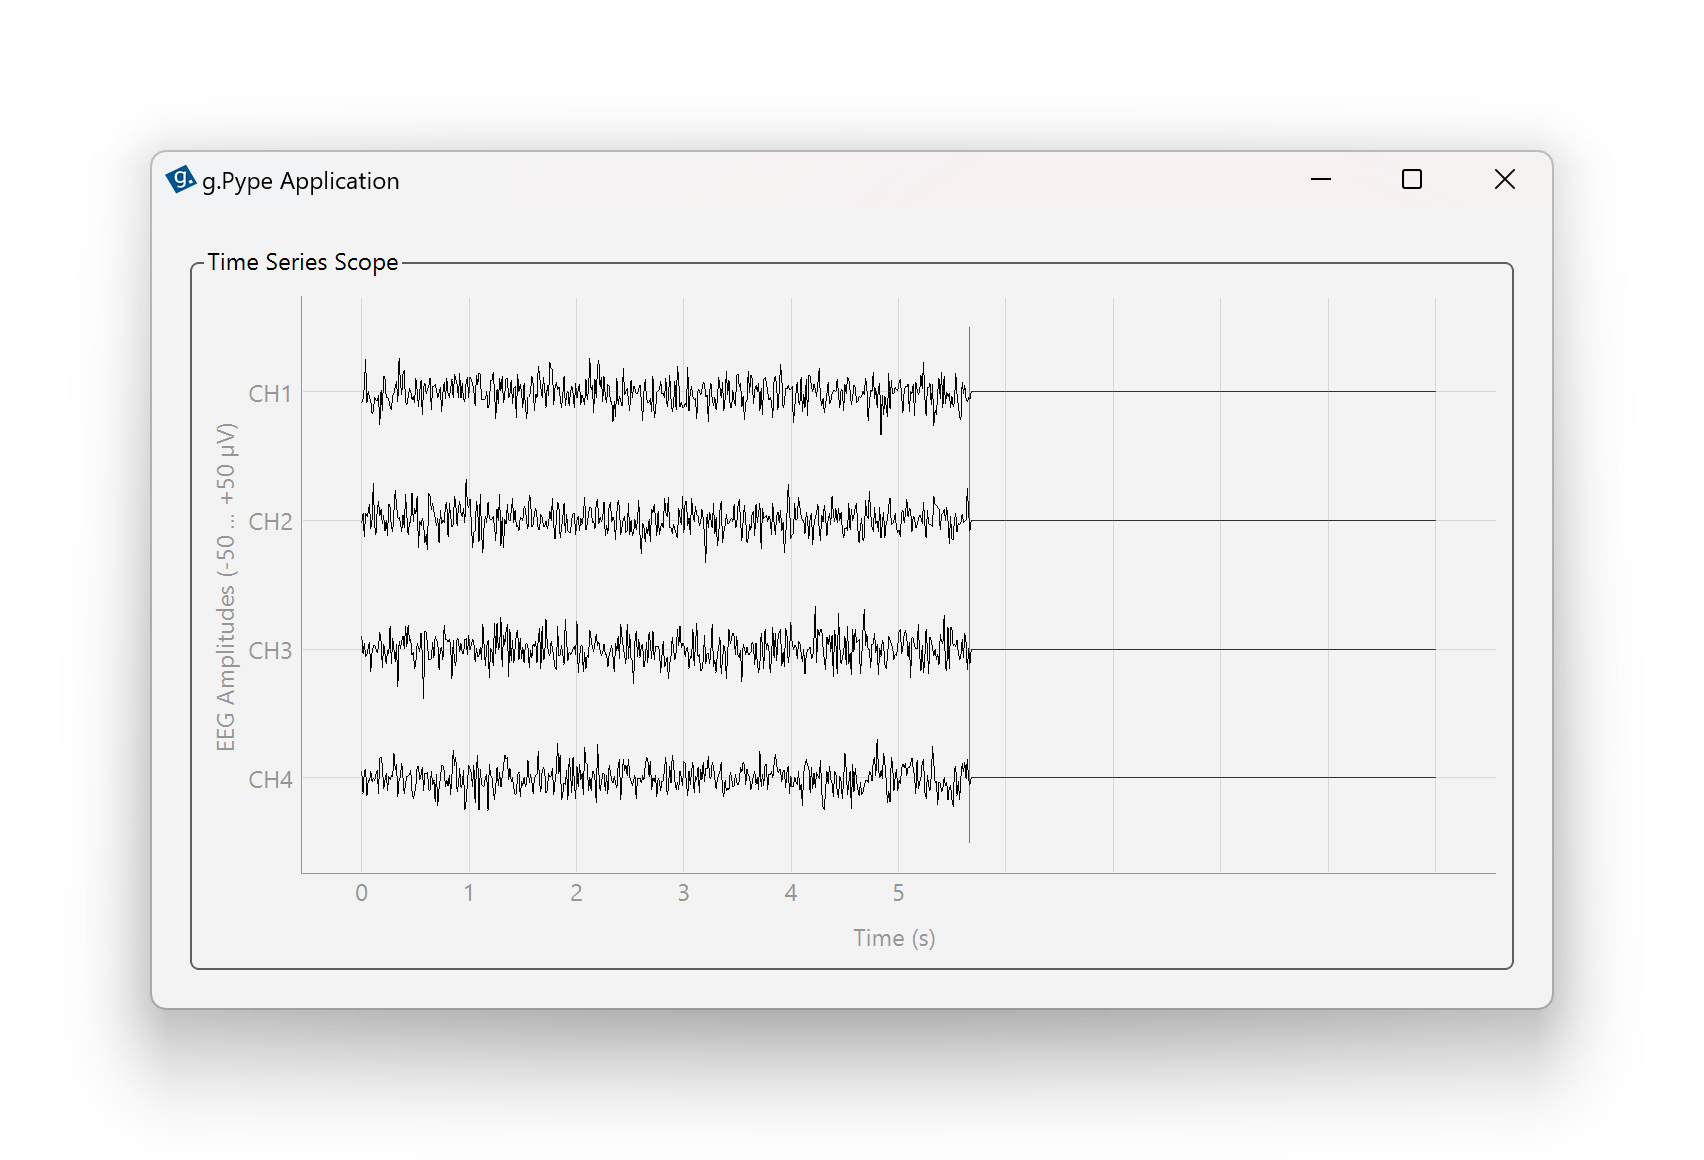
Figure 8: Generating pure noise by setting signal amplitude to 0.
Done! You are now familiar with the most important Generator settings to produce a variety mixtures of signals and noise.
In this episode, you learned how to adjust the Generator parameters to:
Change the number of channels
Adjust signal frequency and amplitude
Select different signal shapes
Add and control noise
All these parameters can be combined to create a wide variety of test signals for your experiments. Note that there are additional options available for advanced use cases. We will cover them in future episodes.
Proceed to the next episode to explore how TimeSeriesScope visualizes time series data in g.Pype.
File s1e3_generator.py – View file on GitHub
 1# --------------------------------------------------------------
 2# Example file s1e3_generator.py
 3# For details and usage, see g.Pype Training Season 1, Episode 3
 4# --------------------------------------------------------------
 5
 6import gpype as gp
 7
 8if __name__ == "__main__":
 9
10    # Create main app and pipeline
11    app = gp.MainApp()
12    p = gp.Pipeline()
13
14    # Create signal source
15    source = gp.Generator(channel_count=8,
16                          signal_frequency=10,
17                          signal_shape=gp.Generator.SHAPE_SINUSOID,
18                          signal_amplitude=25,
19                          noise_amplitude=0)
20
21    # Create scope
22    scope = gp.TimeSeriesScope()
23
24    # Connect nodes
25    p.connect(source, scope)
26
27    # Add widget to main app
28    app.add_widget(scope)
29
30    # Start pipeline and run application
31    p.start()
32    app.run()  # blocking until window is closed
33    p.stop()